Documentation Index
Fetch the complete documentation index at: https://docs.top1.trade/llms.txt
Use this file to discover all available pages before exploring further.
Market Overview & Quick Actions
The upper section focuses on immediate trading context and fast access to essential token data. Here you can:- view the current token price and short-term chart movement
- monitor core market metrics such as liquidity, market cap, and fully diluted valuation
- copy the token contract address directly from the header
- open external information resources like Pump.fun or DexTools for deeper research
- access quick buy presets for rapid execution without switching views

This section is built for fast decision-making while keeping the most important market data visible.
Token Statistics & Safety Indicators
The lower section provides deeper insights into holder distribution, token structure, and potential risk signals. It includes:- holder metrics such as total holders and top 10% concentration
- developer migration and ownership-related indicators
- security flags showing whether a token is mintable, freezable, or team-locked
- timeframe-based statistics (5m, 1h, 6h, 24h) with highlighted positive or negative momentum

Risk Factors & Holder Concentration
TOP1 includes built-in risk indicators to help you quickly assess potential red flags before entering a position. By selecting the warning shield icon, you can access:- Risk Factors, showing whether any suspicious token behavior has been detected
- a clear status indicator, confirming when no risks are currently flagged
- expandable details if specific risk signals are present
.png?fit=max&auto=format&n=lOaETGOlqZYucugW&q=85&s=634bac11b932fb79a6115e2d1c5d590f "Group 1000004777 (2)")
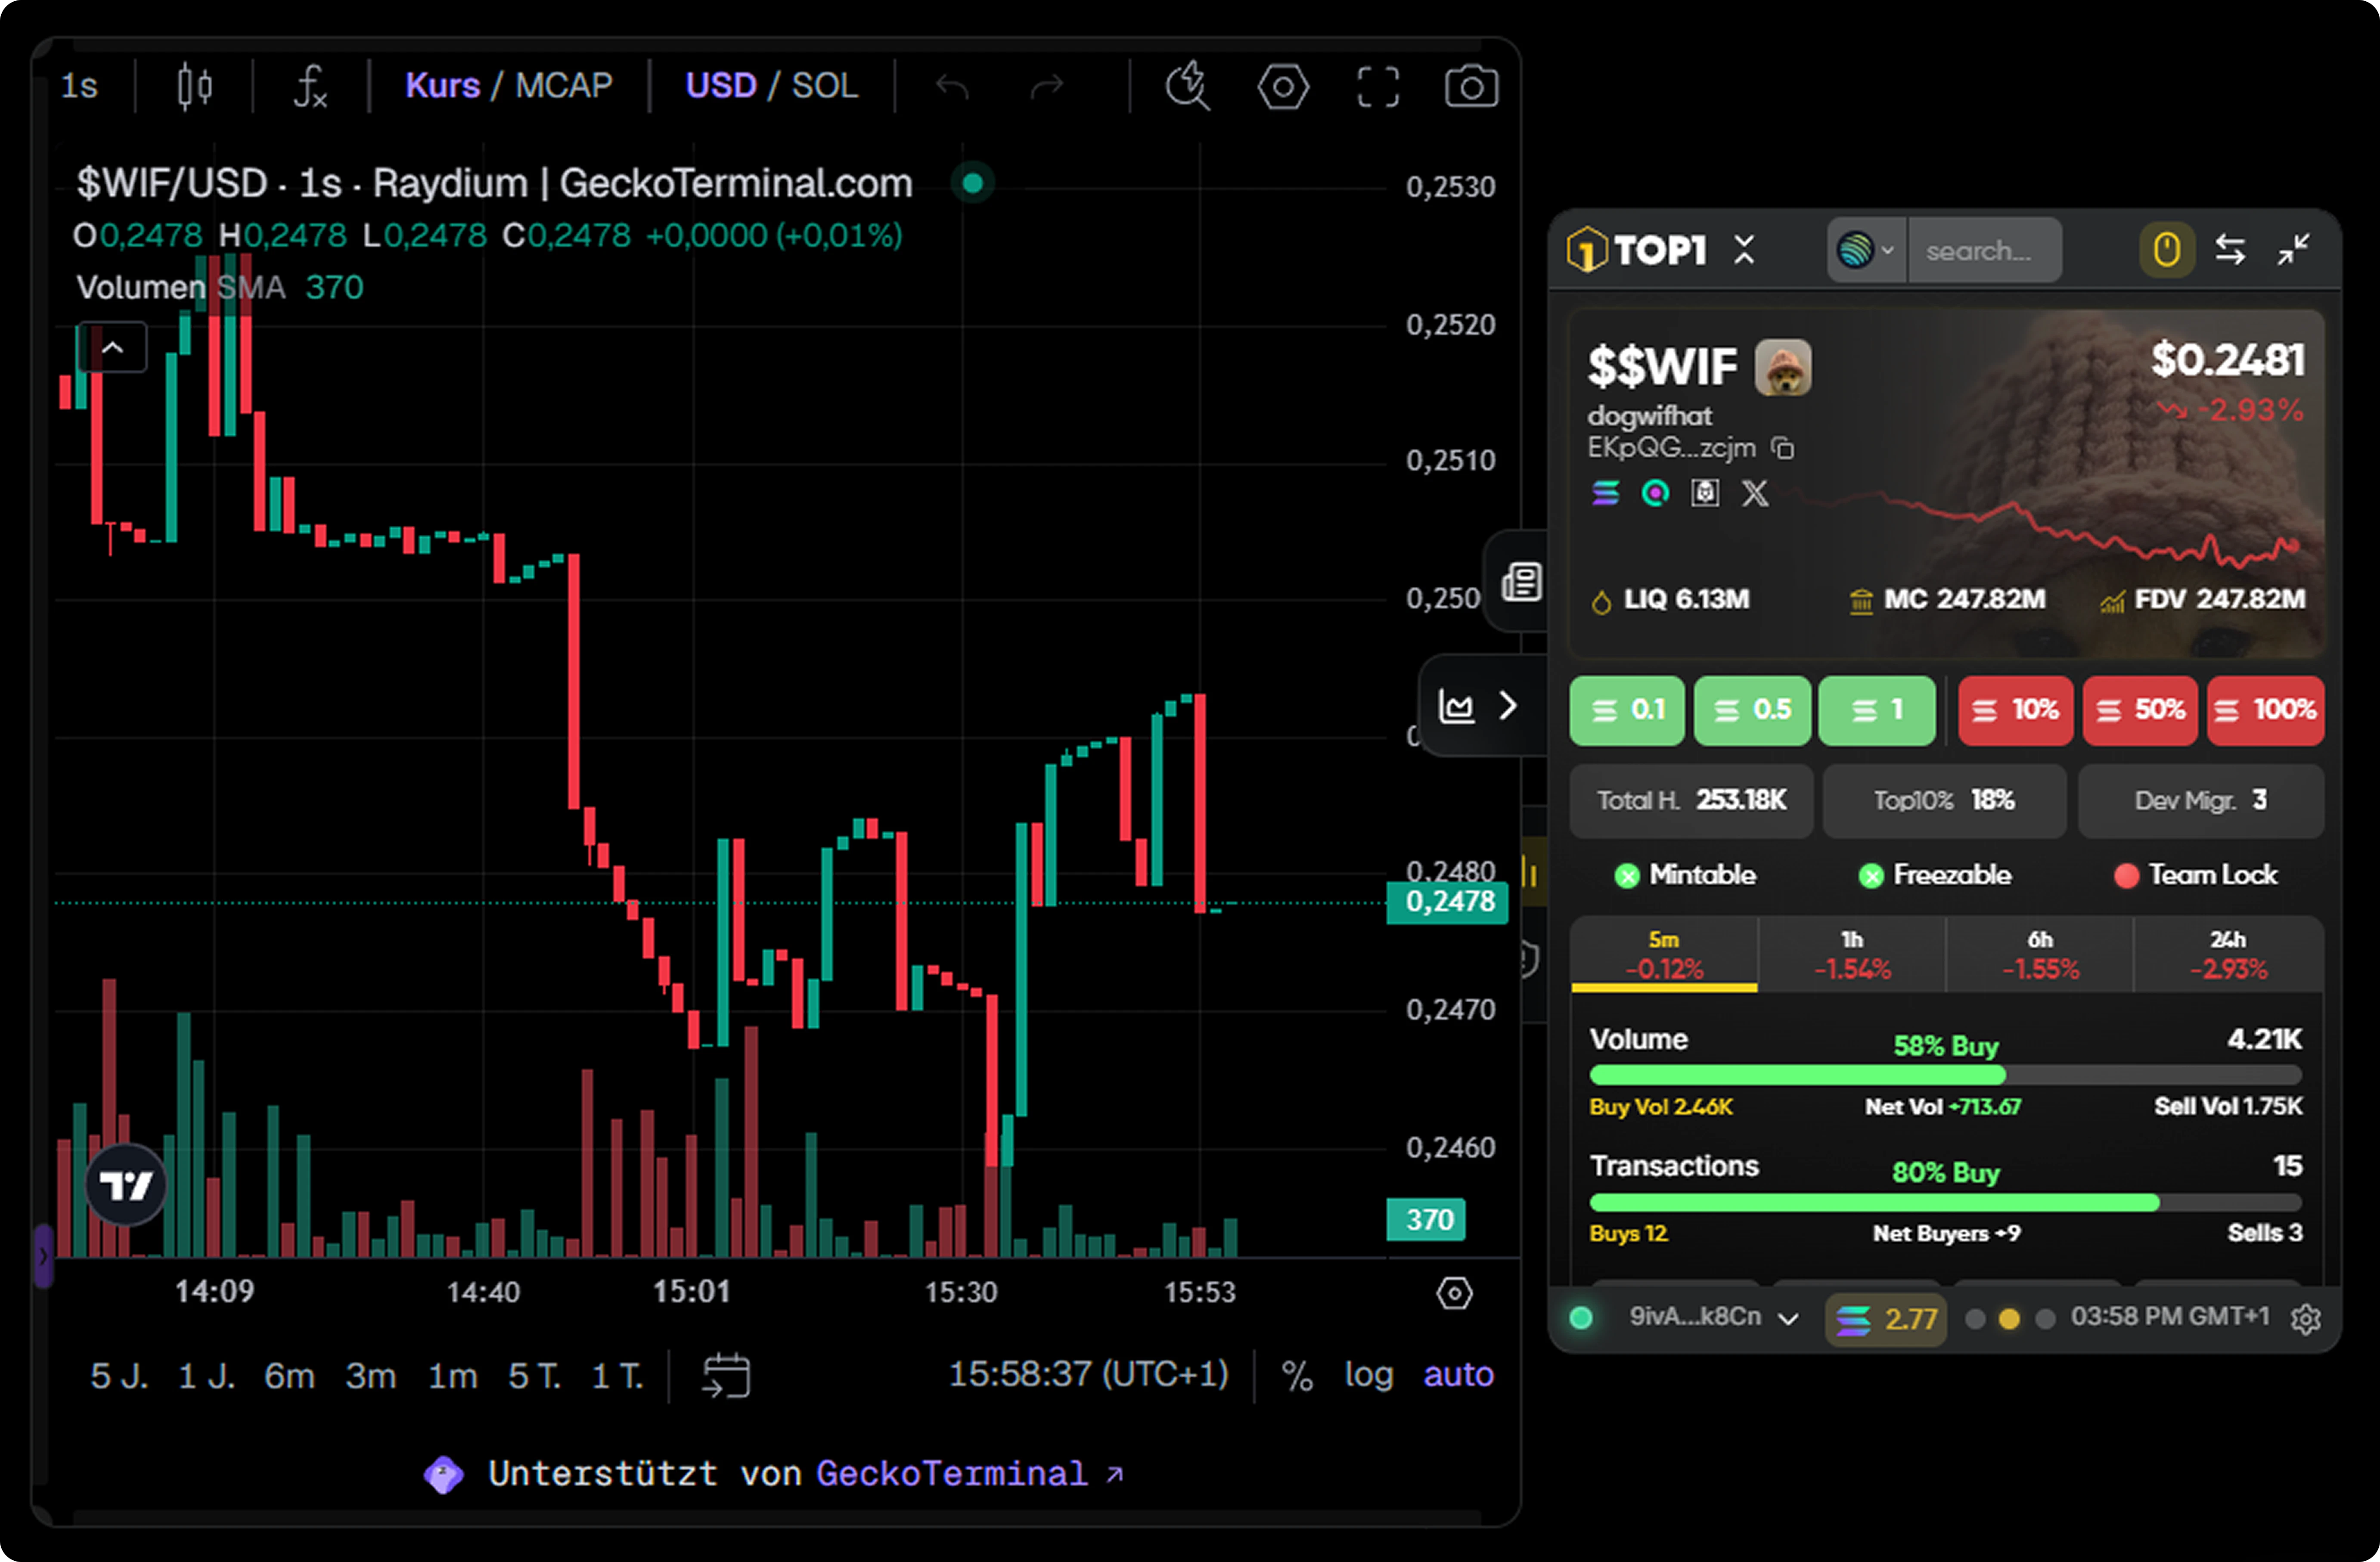
Integrated GeckoTerminal Chart View
For deeper price context, TOP1 allows you to open an expanded chart window directly inside the terminal. By clicking the chart icon on the left, you can access live price data powered by GeckoTerminal, including:- full historical chart movement
- zoom and timeframe controls
- deeper market structure visibility beyond the compact terminal view